Physical Address
304 North Cardinal St.
Dorchester Center, MA 02124
Physical Address
304 North Cardinal St.
Dorchester Center, MA 02124


Quick Answer: This customer journey analysis method works in 60 minutes when you focus on one funnel, one segment, and one fix.
The fastest way to run customer journey analysis is not a “journey map.” It’s a time-boxed diagnostic that pinpoints where users abandon a critical step and why—so you can ship one fix that moves a KPI this week.
Freshness (2026): teams increasingly rely on AI summaries inside session replay tools to spot friction patterns quickly—so the 60-minute promise becomes realistic without heroic effort. For example, session replay platforms now highlight key moments and summarize sessions instead of forcing you to watch everything end-to-end. Hotjar replay summaries | Fullstory session summaries
Internal note: If you’re building an event-driven operating model across the full lifecycle (onboarding → churn), this diagnostic plugs directly into our telco orchestration blueprint. See the event-driven blueprint
Start with a funnel view that shows step-to-step conversion and time to complete. Most analytics tools already support this out of the box (funnels + pathing). If you’re using Mixpanel or Amplitude, you can build a funnel quickly and segment by device/channel to isolate the step that’s actually leaking. Mixpanel Funnels | Amplitude Funnel Analysis
Rule of thumb: flag any single step that loses an unusually large share of users compared to adjacent steps. Don’t obsess over the exact threshold—your goal is to find the “obvious cliff” first.
Keep it brutally simple: one funnel, one time window, one segment. Filter for the last 7 days (or last 14 if volume is low), find the steepest drop, then check whether it’s technical friction (bugs, latency, broken UI) or cognitive friction (confusion, unclear value, too many fields). Not all friction is bad—some is meaningful (e.g., KYC or fraud prevention). The goal is to remove the friction that adds zero value.
| Trigger (what you see) | 60-min diagnostic step | Action (what you do) | Stop Condition (proof) |
|---|---|---|---|
| Big step drop (vs adjacent steps) | Identify the exact step + segment (device / channel) | Check replays + errors + time-to-complete to isolate the root cause | One dominant pattern identified (not “it depends”) |
| High idle time (90–120s+) | Confirm stall behavior (no progress event after start) | Add guidance, reduce fields, improve clarity or fix performance | Idle time drops in the next review cycle (same segment) |
| Intentional drop-off (KYC / fraud checks) | Classify as meaningful friction | Improve transparency: why, how long, what’s next | Completion improves without higher risk flags |
For rapid impact, track step conversion, time-to-complete, and idle time for the step you’re fixing. CEO lens: run this diagnostic weekly with one owner per funnel and one “ship this week” fix. The trade-off is depth vs. speed—start with velocity, then go deeper only when the same leak keeps returning. Next up: three workflows that recover abandoned journeys and turn these findings into revenue.
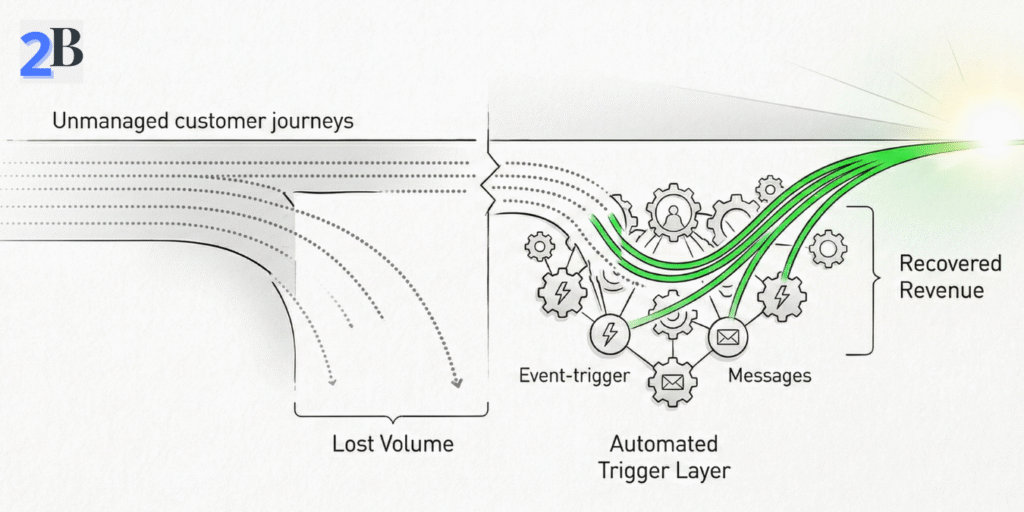
Quick Take: The fastest way to recover lost revenue from abandoned signups, forms, or trials is a time-boxed re-engagement sequence triggered by real behavior—sent while intent is still warm. The goal isn’t “more messages.” It’s one clean path back into the journey with minimal friction.
Start with one funnel and identify the exact abandonment step (signup → email verify, plan select → checkout, onboarding start → activation). Then classify the drop-off as one of three types:
Like2Byte rule: re-engagement only works when the user can resume in one click. If your “return” path drops them back at step one, you’re just reminding them to quit again.
You need three building blocks: (1) a clear abandonment event, (2) a resume link, and (3) suppression rules. Most teams wire this through product analytics (Mixpanel/Amplitude) + automation (Brevo/Mailchimp/HubSpot), using webhooks or API calls to pass the event and a few key properties (plan, page, step, device).
Instead of relying on a universal “best window,” treat timing as a testable assumption: start with an early touch (when intent is high), then add a second message only if the user stays inactive. Measure which timing wins for your funnel and segment.
| Trigger | Action | Stop Condition |
|---|---|---|
| Abandonment detected (form/trial/signup step) | Send “resume in 1 click” message (email/in-app/SMS) with the exact step + next action | User resumes & completes the step OR reaches the final sequence stage |
| No progress after first touch | Send a second message that removes friction (FAQ, 30-sec walkthrough, or “need help?” handoff) | User completes step OR timeout (e.g., end sequence after a few days) |
| User enters support journey (ticket opened / complaint) | Suppress marketing touches and switch to support-only messaging | Ticket closed OR issue resolved |
KPIs to track: recovery rate (step completion after re-engagement), time-to-conversion after first touch, and downstream quality (do recovered users activate or churn quickly?). CEO lens: optimize for one funnel and one segment first, then scale. Trade-off: deeper personalization and tighter timing usually require better event coverage—but batch blasts are cheaper and almost always underperform.
Quick Take: onboarding doesn’t fail because teams lack features—it fails because users don’t reach a first value moment fast enough. Your goal is to define one activation event, reduce friction before it, and instrument “stall signals” so you can intervene in real time.
In most SaaS funnels, early churn is a predictable sequence: sign-up → confusion → stall → silent abandonment. The biggest friction patterns are usually:
Like2Byte rule: if you can’t point to a single “activation event” (one action that proves value), your onboarding will keep expanding forever. Pick one activation goal and optimize everything around it.
Start by defining a single activation goal (e.g., “invite a teammate,” “connect a data source,” “create the first project”). Then instrument the onboarding flow with two types of signals:
Then improve the experience in the simplest order: (1) remove unnecessary required steps, (2) reduce cognitive load with progressive disclosure, (3) add real-time rescue paths (checklist, tooltip, in-app assistant, or human handoff) only where stalls happen repeatedly.
| Step | Critical Checkpoint | Action | Stop Condition |
|---|---|---|---|
| 1. User signs up | First login completes | Show a single next step (activation goal), not a feature tour | User reaches the first screen for the activation action |
| 2. Onboarding starts | Activation goal is acknowledged | Use a short checklist + “resume later” path | User starts the activation action |
| 3. Activation attempt | Action started (import/project/invite) | Detect stalls (idle/retries/errors) and surface contextual help | Activation completes OR user goes idle for 90–120s+ |
| 4. Rescue & recovery | Error / stall detected | Offer 2-step fix + optional human handoff (chat/email) | User resumes OR support ticket created |
KPIs to track: activation rate by cohort, time-to-activation (median), and stall rate on the activation step. CEO lens: prioritize time-to-value first—customization comes later, once you’ve proven early engagement. Trade-off: deeper personalization can improve conversion, but it’s wasted effort if the activation event and rescue paths aren’t stable.
If your onboarding includes billing trust (failed payments / upgrades), the event-driven patterns mirror our telco blueprint: Telecom Customer Journey Orchestration.
Quick Take: post-purchase retention improves when you treat churn as a sequence of signals, not a single “winback moment.” The playbook is simple: detect early risk (usage + billing + support), intervene with the smallest effective action, then stop as soon as the customer is back on track.
The most actionable churn signals usually fall into three buckets. You don’t need a complex model to start—just consistent thresholds and clean events.
Like2Byte rule: distinguish “bad churn” from “fit churn.” Some downgrades are meaningful friction (right-sizing) and should trigger education, not discounts. Your automation should protect margin as much as it protects retention.
Start with three workflows that cover most revenue leakage: (1) usage drop recovery, (2) billing failure recovery, and (3) post-support close-the-loop. Each workflow needs a trigger, a lightweight intervention, and a stop rule to avoid spamming healthy customers.
| Trigger/Event | Action | Stop Condition |
|---|---|---|
| Usage drop (relative to the user’s own baseline) | Send a targeted “value rescue” message: 1 tip + 1 shortcut + 1 resume link | User completes a key action OR usage returns to baseline band |
| Payment risk (failed payment / expiring method) | Run a calm dunning sequence: update link → reminder → support handoff | Payment recovered OR dispute/support ticket opened |
| Support resolved (ticket closed) | Close the loop: CSAT pulse + “next best step” guide | CSAT captured OR user re-engages successfully |
| Downgrade intent (plan downgrade / cancel page view) | Clarify outcomes (not discounts): right-size plan + “keep value” checklist | User keeps plan OR downgrades with feedback captured |
KPIs to track: retention by cohort, payment recovery rate, repeat-contact rate (support), and “value rescue” completion rate (did users actually do the key action?). CEO lens: prioritize billing trust and post-support closure first—those two usually protect the most revenue with the least complexity. Trade-off: deeper personalization can help, but only after your triggers and stop rules are stable.
Fixing drop-offs only matters if it shows up in business metrics: more completed journeys, faster time-to-value, and lower cost-to-serve. This playbook keeps ROI measurement simple, prevents “random optimization,” and shows when to scale beyond the 60-minute method.
Use an assumptions-based model and plug in your numbers. The most reliable ROI signal is incremental completions (extra journeys that finish because of the fix), multiplied by the value of a completion—minus the cost to implement and operate.
Core ROI formula (simple and defensible):
$$ROI = \frac{(N \times \Delta CR \times V) – Cost}{Cost}$$
Where $N$ is eligible users entering the step, $\Delta CR$ is the conversion lift (absolute), and $V$ is the value per completion (AOV for ecom, expected revenue per activated account for SaaS).
Like2Byte rule: don’t measure “lift” on the same day you shipped the change. Use a short before/after window (or A/B if you can) and compare the same segment (device, channel, plan) to avoid false wins.
| What you changed | Primary metric | Proof window | ROI signal |
|---|---|---|---|
| Resume link + re-engagement workflow | Step completion after first touch | 7–14 days (same segment) | Incremental completions × value per completion |
| Onboarding simplification (activation goal) | Activation rate + time-to-activation | 2–4 cohorts | More activated users + lower support load |
| Retention workflow (billing/support) | Recovery rate + repeat-contact rate | 2–4 weeks | Recovered revenue + reduced cost-to-serve |
If you want statistical confidence, use A/B tests where possible. If not, use cohort comparisons and keep the measurement scope tight: one funnel, one segment, one KPI.
This rapid method is designed for teams that can instrument events and ship fixes quickly. It’s not ideal when execution is constrained by governance, missing data, or long multi-stakeholder cycles.
Scale up when you see one of these patterns: the same leak returns repeatedly, multiple funnels interact (pricing → signup → onboarding → billing), or you need cross-channel identity to avoid “zero-context loss.” That’s when you invest in stronger data unification, experimentation discipline, and journey ownership.
Rapid fixes are designed for commercial velocity: find the leak, ship the fix, measure the lift. Full mapping is designed for systemic redesign: cross-channel journeys, governance, and deeper root-cause work. Both are useful—at different times.
| Approach | Time to first results | Best fit scenario | Scaling consideration |
|---|---|---|---|
| Rapid drop-off fix | Days | Core onboarding funnel, activation step, key checkout step | Repeatable weekly; may miss cross-journey causes |
| Full journey mapping | Weeks | Multi-product, multi-channel journeys; heavy governance | Resource-intensive; best when ownership and data are mature |
CEO lens: treat rapid diagnostics as a weekly operating habit, and reserve full mapping for when you’re redesigning the system—not when you just need to stop a leak.
Optional asset (conversion): Create a one-page “Drop-off → Workflow Builder” template (funnel step, trigger, action, stop rule, KPI). This turns the article into something readers can actually implement—and it increases the likelihood they come back to Like2Byte for the rest of the cluster.
Pick one funnel, one segment, and one KPI. Find the steepest step drop or the highest idle time, confirm the dominant pattern using replays/errors, then ship one fix with a clear stop rule. Measure step-level lift over a short window (or run an A/B test if possible).
There’s no universal number. Use a rule of thumb: investigate the step that loses an unusually large share compared to adjacent steps, especially if it repeats across segments. The goal is to find the obvious cliff first, then iterate.
Users don’t always exit immediately—they stall. If someone sits idle for 90–120 seconds on a critical step, it often signals confusion, a blocked action, or a slow/buggy experience. Treat “idle after start” as a drop-off signal and design rescue paths around it.
Bad friction adds zero value (unclear steps, unnecessary fields, errors, latency). Meaningful friction is intentional (KYC, compliance, fraud checks). You usually shouldn’t remove meaningful friction—you should explain it clearly (why, how long, what’s next) and reduce uncertainty.
Measure incremental completions attributable to the fix, multiply by the value per completion (AOV or expected revenue per activated account), then subtract implementation and operating costs. Keep scope tight: one funnel, one segment, one KPI—then scale.